
In this article
I love black solar panels. I said that when Markus Lambert asked me about them, and I’m quite happy for appearance to be part of someone’s buying decision. It’s your house. You’re the person who’ll be looking at it.
I’d still want to see what the preference costs, both in dollars and in the system I end up with. If I’m paying more for the finish, I’d like that choice put in front of me clearly.
Look at it from the street
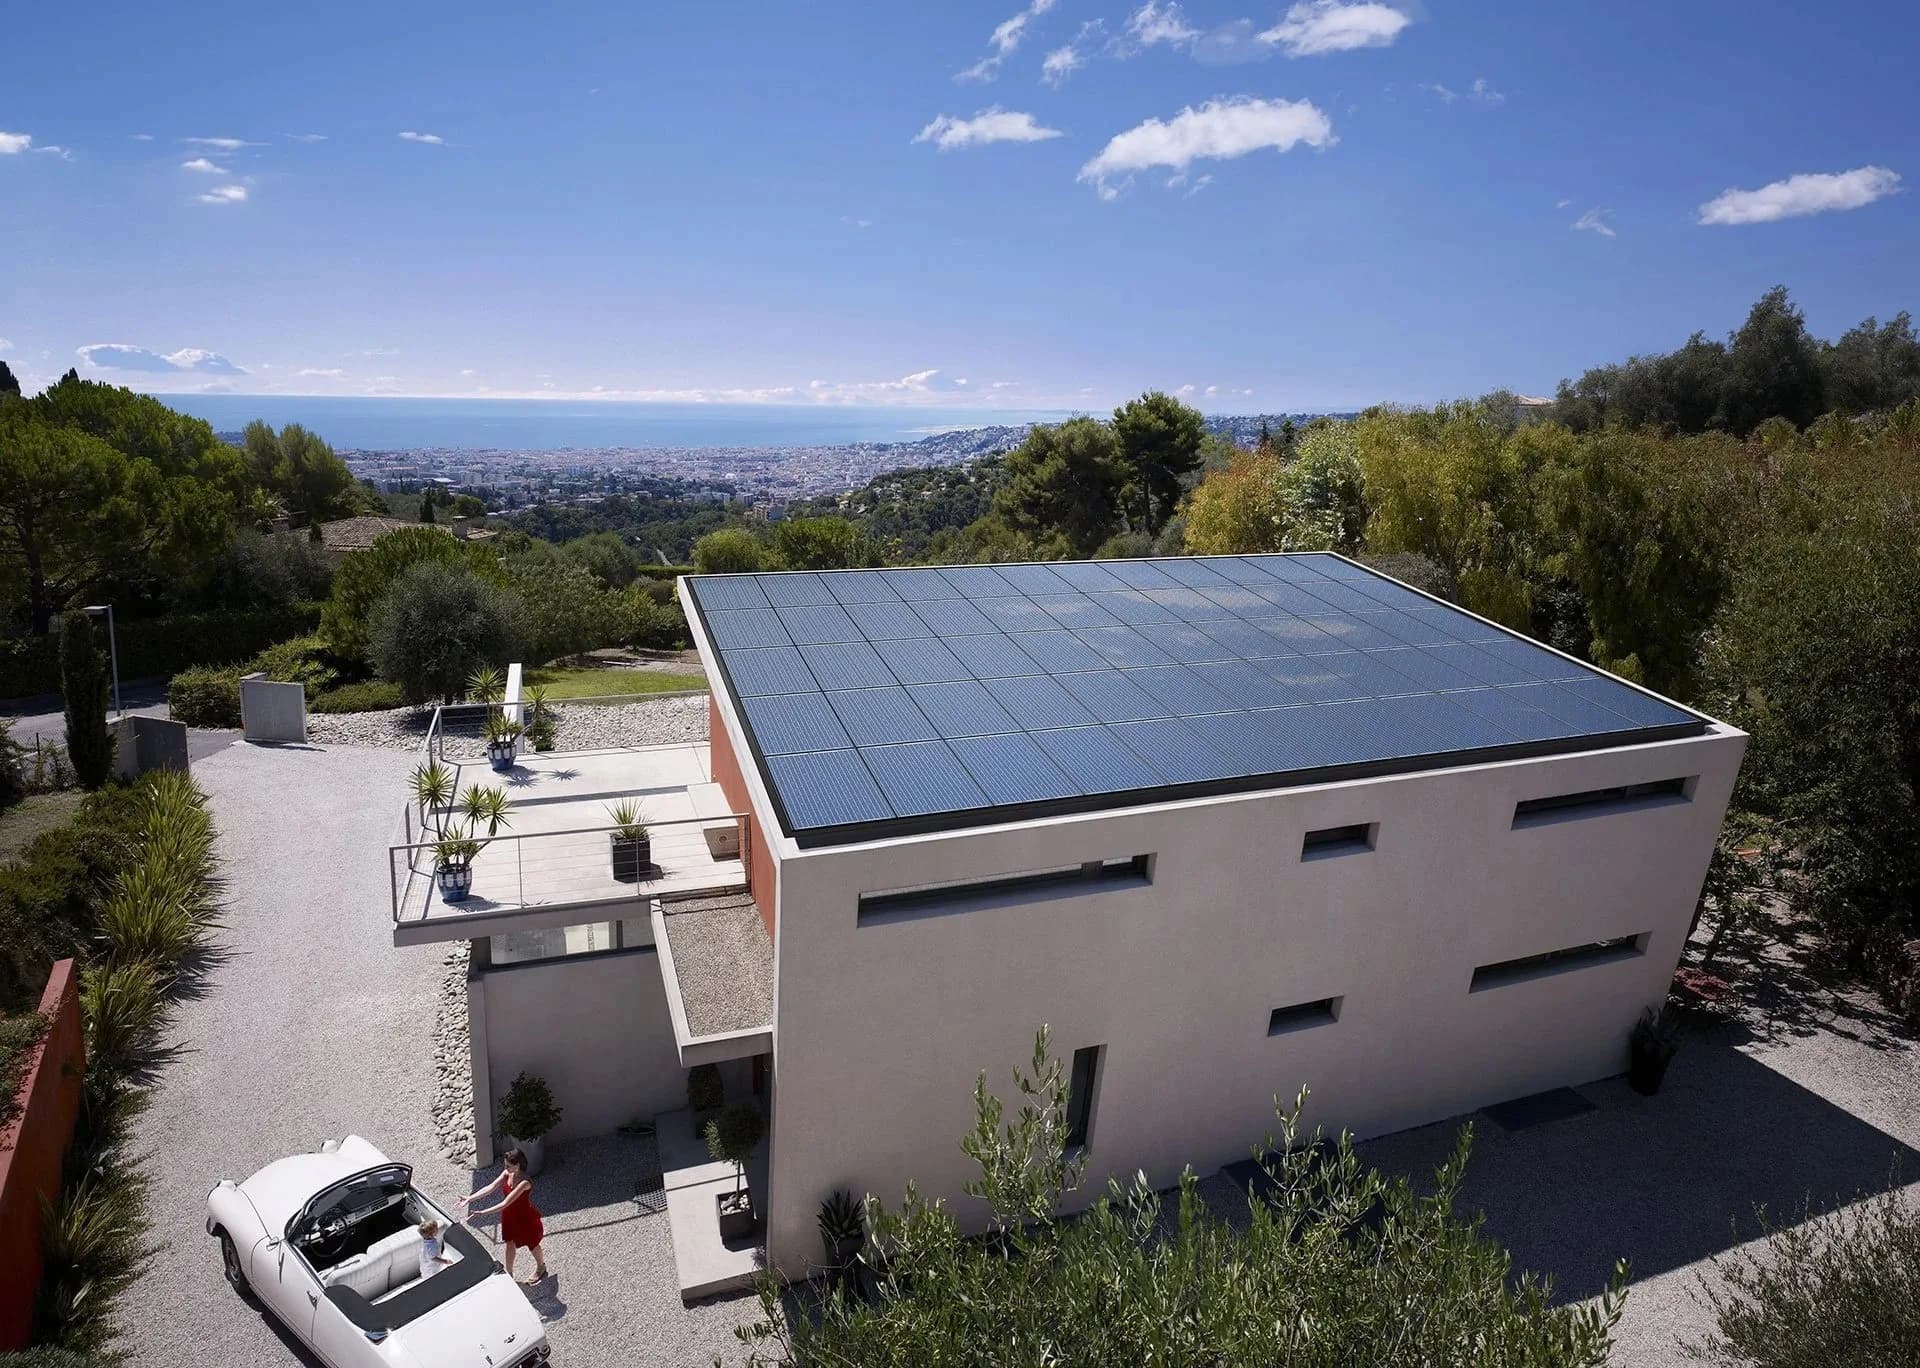
I’d start with a drawing of the panels on my roof. Which roof faces are being used? How much of the array will I see from the driveway or the street? Will the panels look like one considered installation?
The finish of a panel is easier to judge when it’s part of that picture. I’d also ask about the visible clamps and rail ends. In my conversation with Markus, I mentioned black mounting hardware because the fittings contribute to the finished appearance too.
If the panels are tucked away on a roof I barely see, I might put less money into the finish. On a prominent roof face, I’d give it more weight. Both seem reasonable to me.
Give me the exact panel
When a quote says ‘black’, I’d ask for a close photograph of that exact model. I’d want to see the frame, the cells and the spaces between them. A small picture of a house in a brochure can hide quite a lot.
Then I’d match the model number in the quote to its datasheet. If I’m choosing a particular appearance, I want to know that the panel being ordered is the one we’ve been discussing.
The two figures I’d compare
Module efficiency helps me compare how much rated power the finished panels offer for the roof area they occupy, under the same test conditions. I’d look for the module figure on both datasheets. A headline about the efficiency of an individual cell doesn’t give me that comparison.
I’d also look at the temperature coefficient of maximum power, often labelled Pmax. For the usual negative figures on silicon-panel datasheets, a number closer to zero means a smaller rated power loss as the cells heat up. It’s worth keeping the minus sign in mind when someone says one figure is ‘lower’.
The reference temperature is cell temperature. Jinko’s published datasheet, for example, specifies 25°C cell temperature for its standard test conditions. That isn’t a forecast of the temperature of a Perth roof in summer.
Those two figures help me ask better questions. They still need to sit alongside the proposed layout, shading, inverter and installation. I wouldn’t treat either one as a forecast of my annual electricity production.
A different finish.
How much different energy?
Compare two published Jinko models, with 15 panels on each roof. Start at the same rating, then see what changes when one quote offers 5 W more per panel.
Both publish −0.29%/°C for power and 45 ± 2°C nominal operating cell temperature. At 440 W, both also publish 22.02% module efficiency.
No difference with these assumptions.
- All-black total
- 235,560 kWh
- White-backsheet total
- 235,560 kWh
The lines overlap because these inputs produce the same result. Colour alone does not establish a yield penalty.
Calculated scenarios, not measured yields or a forecast for your roof. The starting 10,000 kWh is an illustration. Change it below to explore a different first-year yield.
Adjust the assumptions
See the numbers and method
| Year | All black | White backsheet | Difference |
|---|---|---|---|
| 1 | 10,000 | 10,000 | 0 |
| 2 | 19,950 | 19,950 | 0 |
| 5 | 49,502 | 49,502 | 0 |
| 10 | 97,780 | 97,780 | 0 |
| 15 | 144,862 | 144,862 | 0 |
| 20 | 190,779 | 190,779 | 0 |
| 25 | 235,560 | 235,560 | 0 |
The calculation scales the white-panel first-year energy by the rated-power ratio and a temperature-factor ratio. Both arrays then use the same annual decline: energy in year n = first-year energy × (1 − decline)n−1. The chart adds the annual values without rounding them first.
Temperature factor = 1 − 0.0029 × (cell temperature − 25°C). The sensitivity test assumes a 45°C energy-weighted cell temperature for the white panel, with the chosen extra heat added for black. That 45°C is an illustration, not an annual temperature inferred from NOCT. The reference yield already includes the white panel’s temperature losses, so the tool uses the ratio of the two factors.
The roofs, panel count and shared losses are held equal. Weather variation, shade, orientation, inverter clipping, outages and different ageing rates are not simulated. A complete roof-specific energy model is needed to estimate those effects. These datasheets describe different product revisions, not a controlled test that changes only the backsheet.
Manufacturer sources: All-black 54HL4R-B · G2 datasheet; 54HL4R-(V) · F1.3C1 datasheet. Temperature relationship: pvlib’s PVWatts DC model. Specifications checked 4 November 2026. Model examples do not indicate current PSW availability.
Put a price on that choice
I’d ask the installer to show me two complete options for the same roof, with the panel models, layout and installed prices written down. If there’s a difference in expected generation, I’d want to know what assumptions produced it.
That lets me decide whether the appearance is worth the difference. I don’t need someone to promise that black panels will add a particular amount to the value of my house. I need to know what I’m buying and what else I could do with the money.
I’d happily give a good-looking installation a place in that decision. I’d just compare the actual panels and the finished roof before making it.